The ThreeME model
OFCE, NEO
22 septembre 2023
1 The ThreeME model
Multi-sector Macroeconomic Model for the Evaluation of Environmental and Energy policy
Macroeconomic multi-sector model with neo-keynesian features
- Avoid the limitations of standard CGE models
- Say something about the medium term (not only the long term)
- More realistic results for policy makers
- Similar dynamic and long term properties than the macroeconomic models used in Economic ministries and forecasting departments
- Avoid the limitations of standard CGE models
Open source model: www.threeme.org
- To avoid usual criticisms on models: black-box, impossible to verify independently the results, too few users
- Make application to other countries and by other institutions easier: EU, Mexico & Indonesia (AFD); Tunisia (UNEP), UK (OECD), Luxembourg (Statec), DG Trésor
2 Multisector model
n sectors (e.g. France: n = 37; Tunisia: n = 21, Mexico: n = 24, Luxembourg: n = 26)
Allows to analyze the effect of transfer of activities from one sector to another on:
- Employment, due to different labor intensity
- Investment, due to different capital intensity
- Energy consumption, due to different energy intensity
- Trade balance, due to different propensity to import and export
3 Example of sectoral decomposition
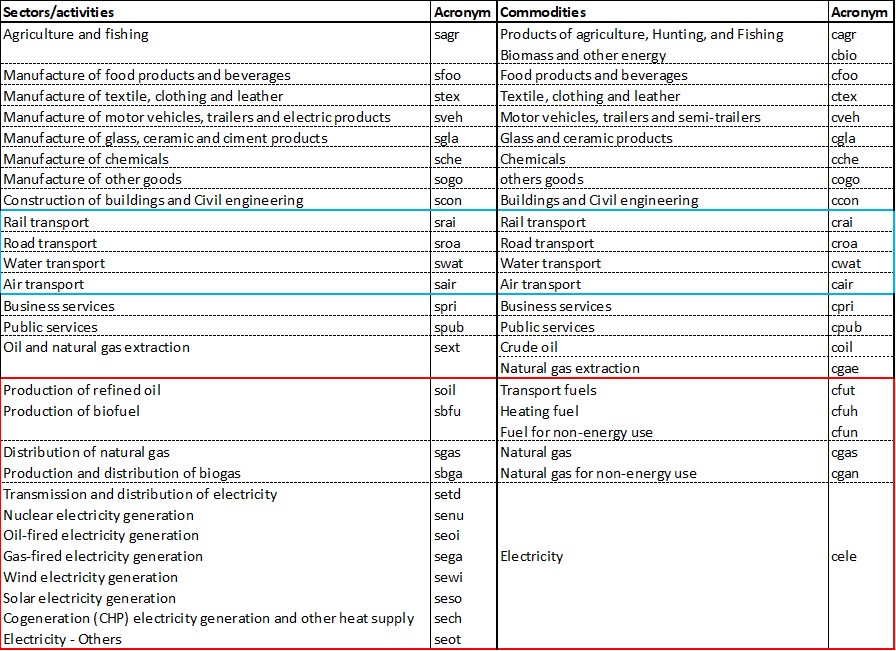
The economy is disaggregated into 27 sectors, with in particular:
- 4 transport sectors
- 12 energy sectors
- Of which 10 technologies for the production of electricity
And 23 commodities
- A commodity can be produced by several sectors
- Ex: electricity
- A commodity can be produced by several sectors
The disaggregation is a compromise between the availability of the national account and energy data and the objective of the model
Several sectors have to be disaggregated
- Electricity and gas
- Transport
4 Example of sectoral decomposition
5 Focus on energy
The energy disaggregation allows for analyzing the energy behavior of economic agents:
- Sectors can arbitrate between different energy investments:
- Substitution between capital & energy when the relative energy price increases
- Substitution between energy sources
- Substitution between transports
- Endogenous energy efficiency: technical progress increases when the relative energy price increases
- Consumers
- Substitution between capital & energy
- Substitution between energy sources
- Substitution between transports
- Substitution between goods
- Sectors can arbitrate between different energy investments:
6 Type of simulation of the economic and environmental impact
Energy transition policies
- Fiscal policies:
- Carbon tax with or without redistribution of the tax revenue
- Phasing out subsidies on (fossil fuel) energy
- Bonus-malus for cars: subsidies on green cars financed by a tax on other cars
- Change in the electricity production mix
- Ex: more RES in the mix
- Impact of green investment
- In buildings, public transport, etc.
- Impact of applying a new standard for buildings, or appliances
- Fiscal policies:
External shock
- Increase in international oil/gas price
7 CGE model
Computable: numerical simulation
General: take into account the interactions between markets.
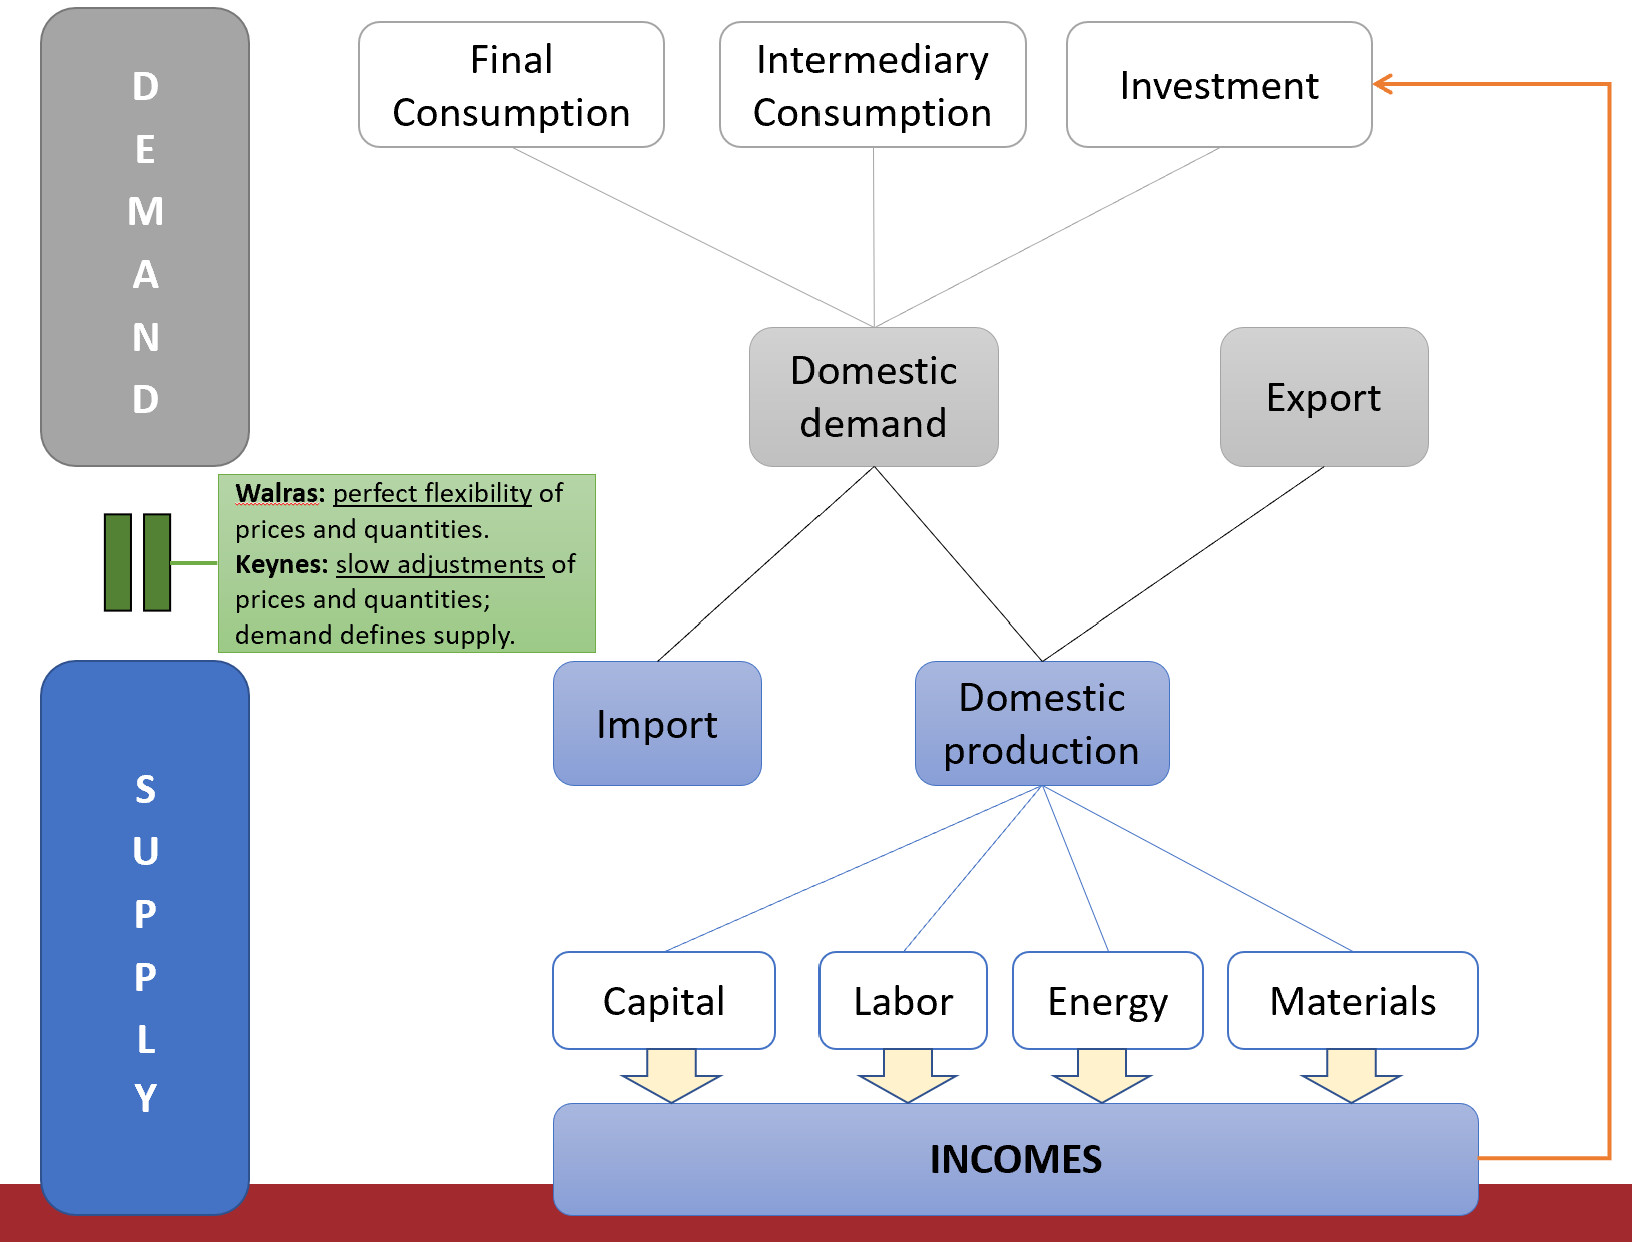
- Supply and demand influence each other
Equilibrium: Supply is equal to demand on all markets (good, production factors)
Structure of a CGE model (see next Figure):
- Demand (Consumption, investment) defines the supply (production)
- Supply defines in return the demand through the incomes generated by the production factors
8 CGE model
9 What does « general equilibrium » mean?
General Equilibrium relates to a state where supply is equal to demand in all markets
2 main approaches to insure this state:
- Walrasian models
The equilibrium force is the price system
Perfect price flexibility insure the instantaneous equilibrium between supply and demand
When the supply of a commodity goes down, its price tends to go up, thereby stimulating additional supply and depressing demand, until supply and demand are equal again.
Static model
- Neo-Keynesian models
- Demand determines supply
- Price and quantities are rigid and adjust slowly
- Disequilibrium between notional (optimal) supply and the actual supply in the short run
- Dynamic model: transition to the long run
- Walrasian models
10 A neo-keynesian CGE model
Slow adjustment of price and quantity
- Adjustment costs
- Empirically firms adjust their production to the demand rather than their price
Leads to situation of disequilibrium between the desired supply and demand
Prices are defined as a mark-up over the firm’s production costs
- Production costs integrate intermediary consumption (material and energy), labor and capital costs
11 A neo-keynesian CGE model
Wages are determined by a Wage Setting (WS) curve
- Phillips curve: wages increase with inflation and decrease with unemployment
- Wages do not adjust instantaneously the supply and demand for labor:
- Permanent underemployment equilibrium possible
- Theory of the NAIRU (Non Accelerating Inflation Rate of Unemployment) or Equilibrium rate of unemployment
The interest rate does not equilibrate instantaneously saving and investment:
- It is defined by the Central Bank
- « Taylor » reaction function: increases with inflation, decreases with unemployment
12 Key properties of ThreeME
General equilibrium effects
- Supply influence demand and vice versa
Direct and indirect effects of the energy transition
- Direct effects: impact for the energy sectors
- Indirect effects: impact for the rest of the economy (in particular the other sectors, the government, households).
Limited eviction effects
- Investment is not only defined by saving
- The financing through bank credit does not necessary lead to an increase of the interest rate
- The augmentation of investment in one sector is not necessary achieved through a decrease of investment in other sectors
13 The value-added compared to existing models
Sectorial disaggregation
- Make explicit the negative and positive impacts for each sector according to its own specificities.
- Make explicit the negative and positive impacts for each sector according to its own specificities.
High technological disaggregation of the energy system
- Ex: electricity produced by several technology
- Each technology having their own cost and production function
- Link between economic activity, energy production in physical terms (Mtoe or Mwh) and CO2 emissions more accurate.
General Equilibrium
- Allows for taking into account of indirect and feedback effects (rebound effects)
Neo-keynesian features
- Allows for studying transition and disequilibrium phases (such underemployment)
14 The value-added compared to existing models
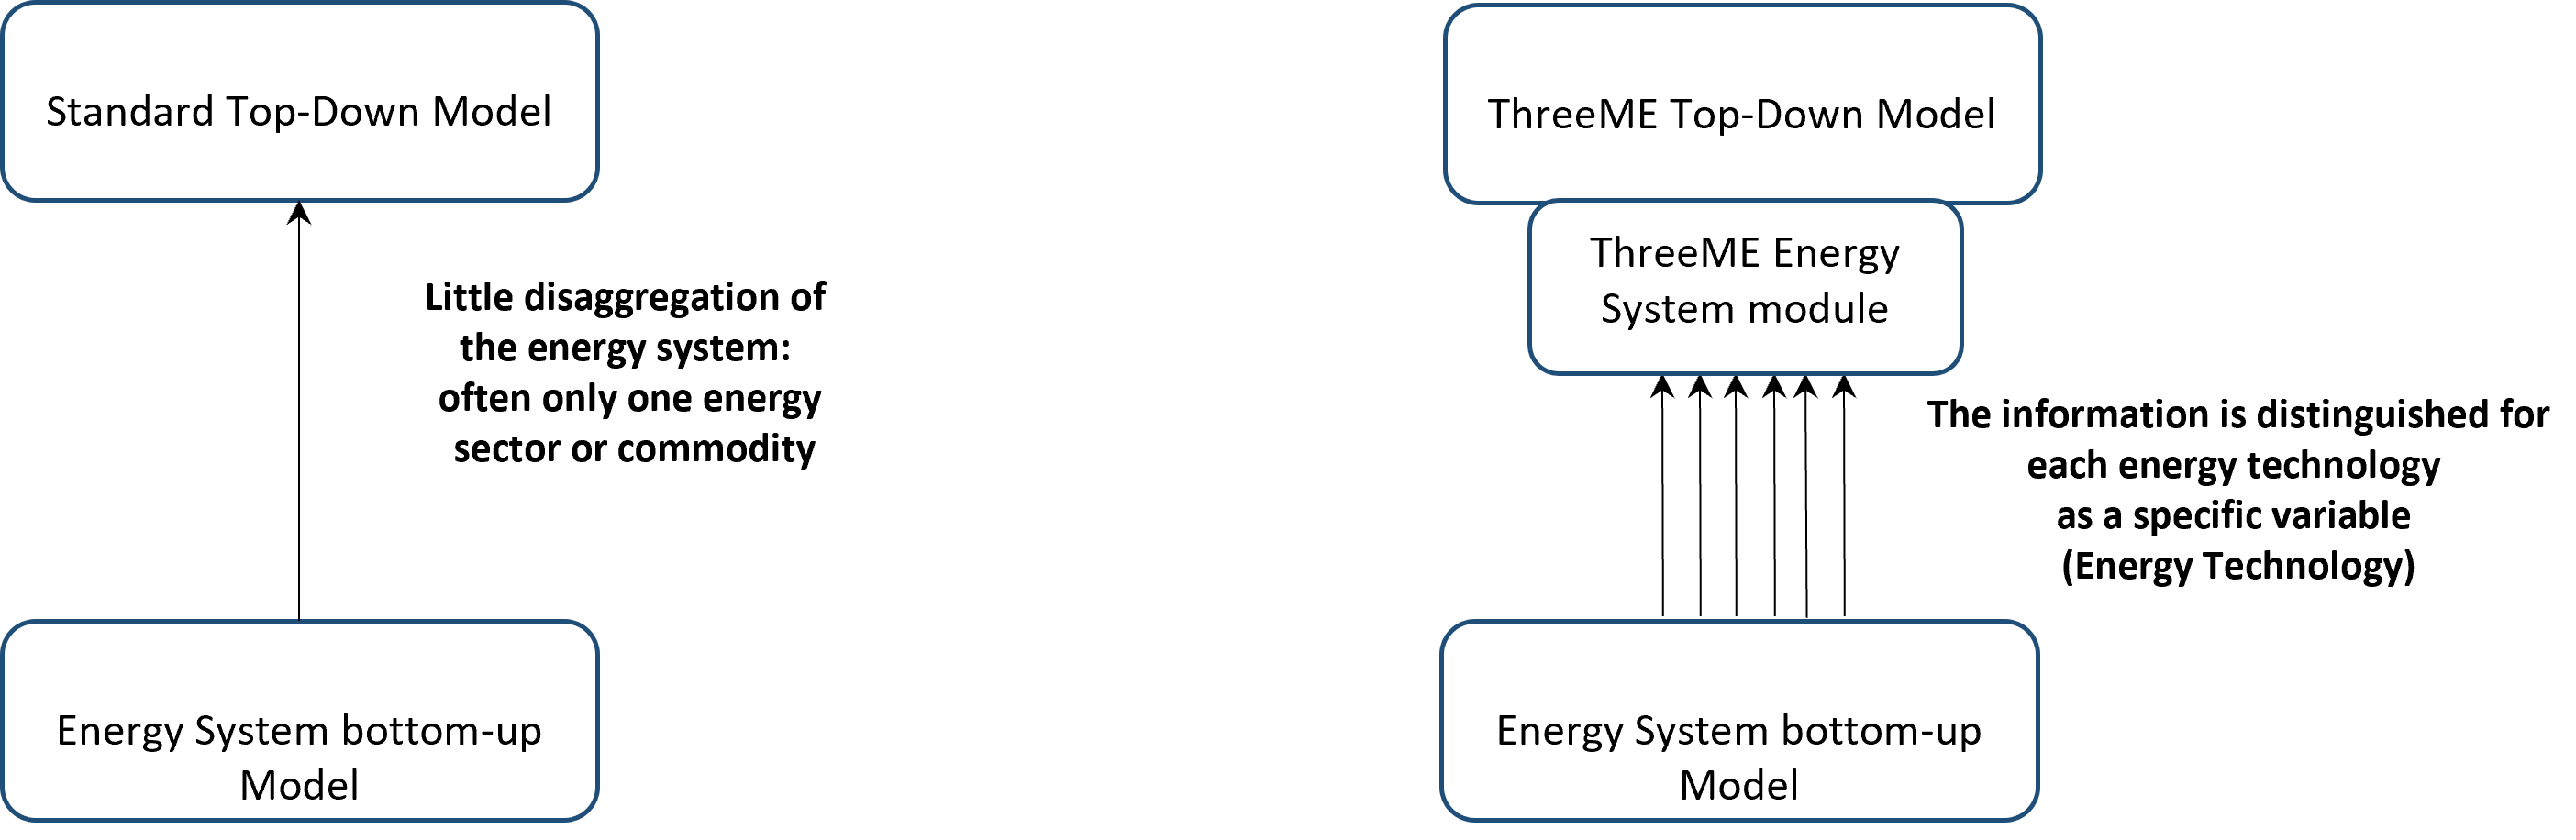
Hybrid modelling
- Link bottom-up and top-down approaches
- Detailed energy technologies and coherent macroeconomic framework
Possibility of combination with an energy system model
- The bottom-up development of the energy sectors makes it possible to combine ThreeME with an energy system model without loss of relevant information
- Assessment of scenarios compatible with the technical constraints regarding the feasible energy mix.
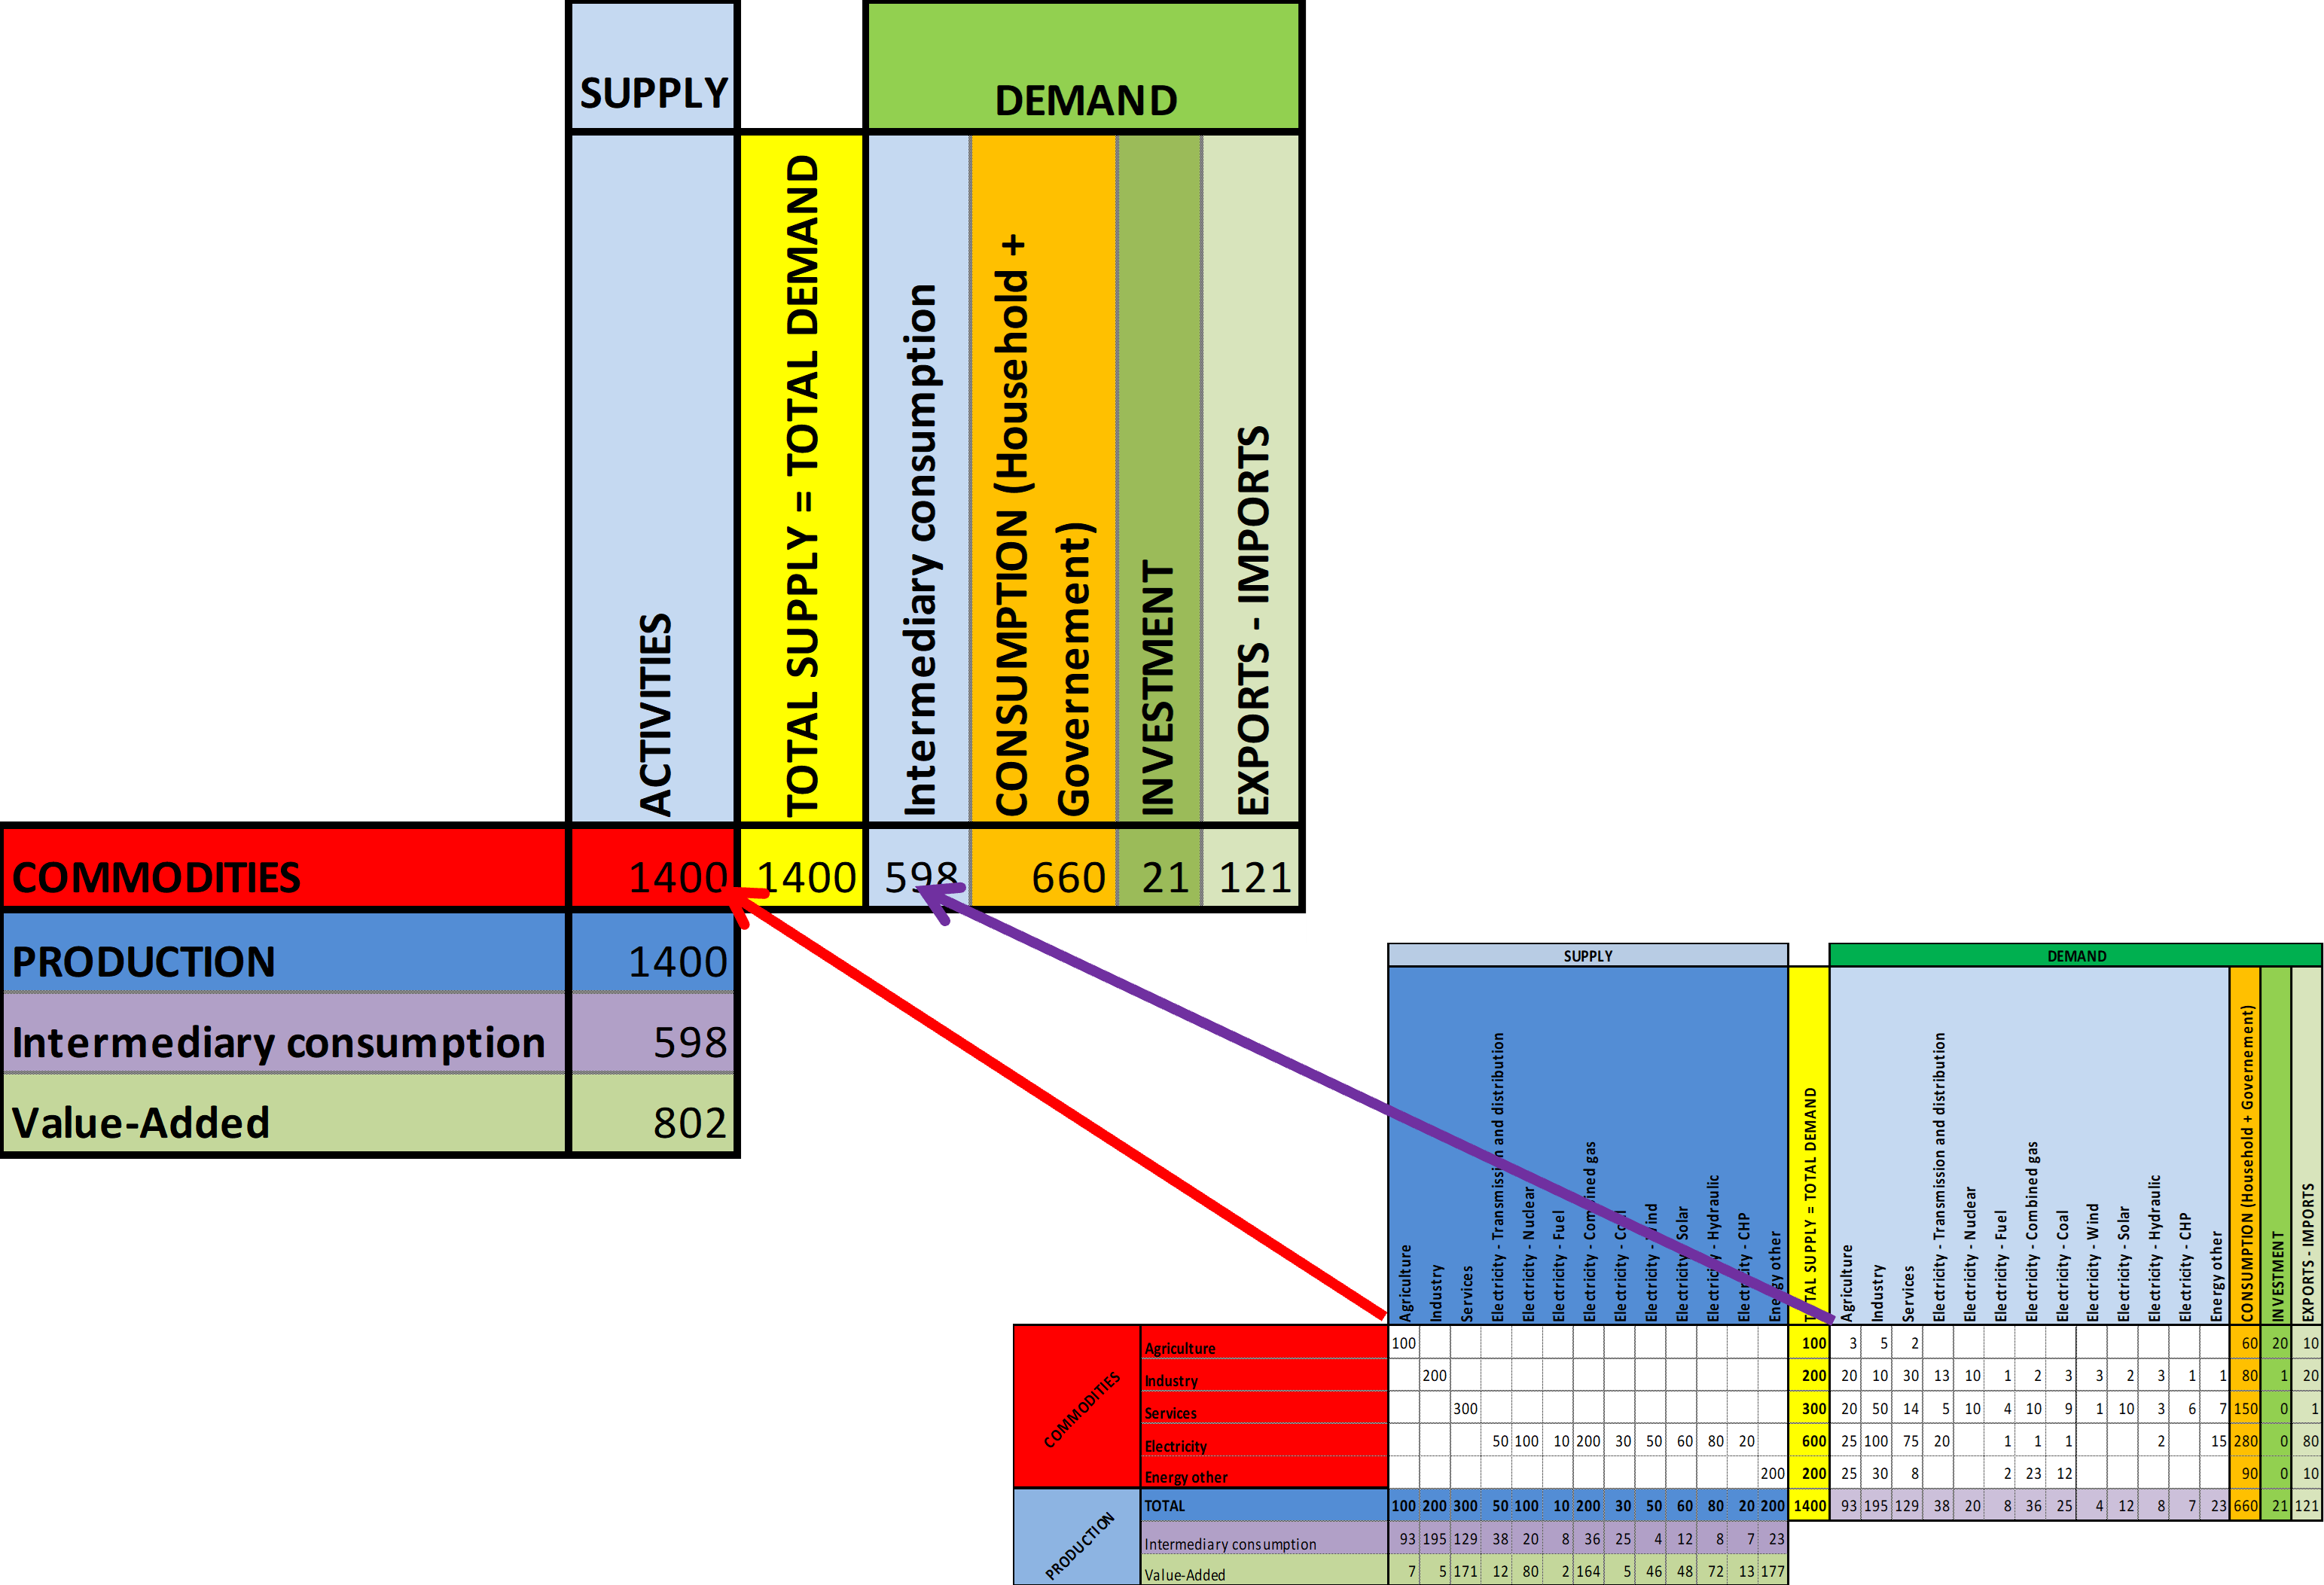
15 Data: Supply-Use (SU) and Input-Output (IO) tables
SU table says how much a given commodities is supplied by a given sector (Supply)
- Generally close to a diagonal matrix
IO table says how much a given commodities is purchased by a given sector (Demand)
- Not a diagonal matrix
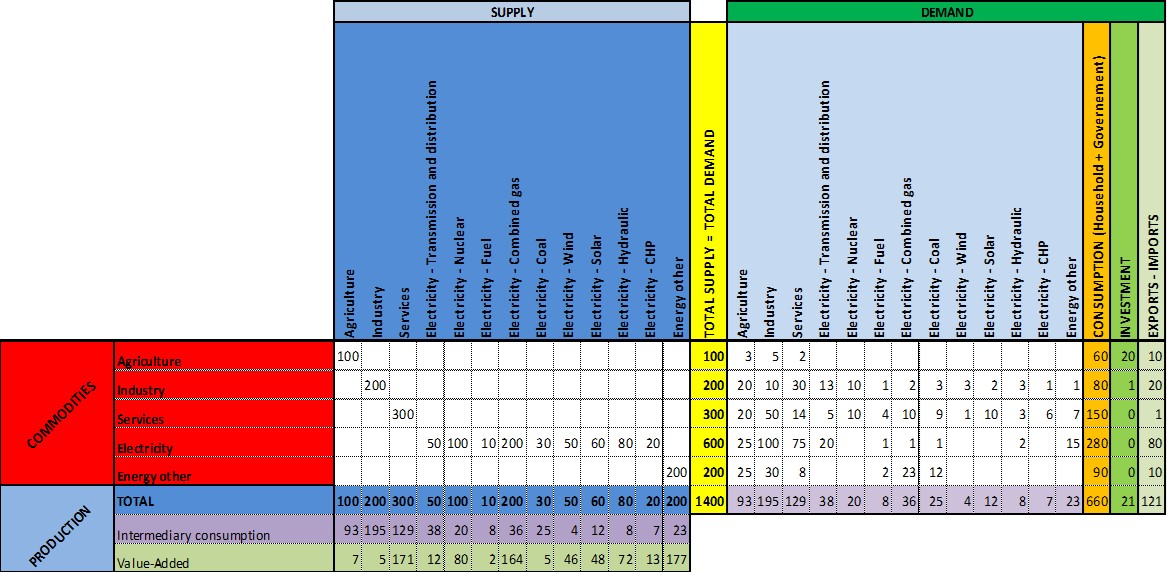
16 Equilibrium between Supply and Demand (use)
- GDP = VA = Y – CI = C + I + X - M